
10 Minutes to Graphistry Visualization#
This guide covers core visualization topics like the difference between uploading and viewing graphs, how the client/server architecture works, and how to use PyGraphistry’s fluent API to create powerful visualizations by combining ideas like encodings, layouts, and settings. Finally, we overview how to embed visualizations into different workflows.
Key Concepts#
Client/Server Architecture: Uploading vs. Serving vs. Viewing#
PyGraphistry uses a client-server model. By separating the uploader, server, and viewer, we can achieve better performance, new capabilities, and a variety of usage modes.
Upload Client: In your local environment, you can shape data and call the Graphistry API to upload it to a server (self-hosted or Graphistry Hub).
Visualization Server: The server processes the data using GPU acceleration to handle large graphs.
Visualization Client: The graph is then explored in your browser, where interactions like zooming and filtering are handled smoothly by using local and remote GPU resources as appropriate.
This split architecture allows scalable, high-performance visualization for even the largest datasets.
Fluent API Style#
PyGraphistry uses a fluent style API, which means that methods can be chained together. This allows for concise and readable code without an extensive setup:
g1 = graphistry.edges(df, 'src', 'dst')
g2 = g1.nodes(df2, 'n')
g3 = g2.encode_point_size('score')
g3.plot()

# As shorter fluent lines
g = graphistry.edges(df, 'src', 'dst').nodes(df2, 'n')
g.encode_point_size('score').plot()
This approach lets you layer operations as needed, keeping code light and intuitive.
Shaping Your Data#
PyGraphistry supports flexible shaping of your graph data:
`.edges()` & `.nodes()`: Define edges between entities and optional node attributes
# df[['src', 'dst', ...]]
graphistry.edges(df, 'src', 'dst').plot()

# ... + df2[['n', ...]]
graphistry.edges(df, 'src', 'dst').nodes(df2, 'n').plot()
Example visualization:
Hypergraph: Use multiple columns for nodes for more complex visualizations
# df[['actor', 'event', 'location', ...]]
hg = graphistry.hypergraph(df, ['actor', 'event', 'location'])
hg['graph'].plot()
UMAP: Dimensionality reduction & embedding visualization tool based on row similarity
# df[['score', 'time', ...]]
graphistry.nodes(df).umap(X=['score', 'time']).plot()
These methods ensure you can quickly load & shape data and move into visualizing.
Layouts#
PyGraphistry’s Layout catalog provides many options, covering:
Live Layout: Graphistry performs GPU-accelerated force-directed layouts at interaction time. You can adjust settings, such as gravity, edge weight, and initial clustering time:
g.settings(url_params={'play': 7000, 'info': True}).plot()
PyGraphistry Layouts: PyGraphistry ships with special layouts unavailable elsewhere and that work with the rendering engine’s special features:
g.time_ring_layout('time_col').plot()
Plugin Layouts: Integrated use of external libraries for specific layouts:
Static Graphviz render (for docs/notebooks)#
When you need a quick static image without an interactive client, render directly with Graphviz. plot_static auto-displays in Jupyter and returns an SVG/Image object (use .data for raw bytes):
# Auto-displays inline in Jupyter notebooks
g.plot_static(format='svg', max_nodes=200, max_edges=400)
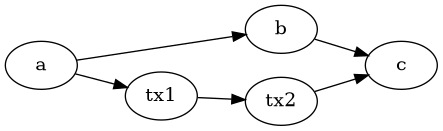
Example visualization (static):

Text-only outputs#
Emit DOT or Mermaid DSL for downstream rendering or embedding:
dot_text = g.plot_static(engine='graphviz-dot', reuse_layout=True)
mermaid_text = g.plot_static(engine='mermaid-code', reuse_layout=False)
Example DOT output:
digraph G {
    a -> b;
    b -> c;
    a -> tx1;
}
Example Mermaid output:
graph LR
  a --> b
  b --> c
  a --> tx1
External Layouts: Pass in
x,ycolumns, such as from your own edits, external data, or external ML/AI packages:# nodes_df[['x', 'y', 'n', ...]] g = graphistry.edges(e_df, 's', 'd').nodes(nodes_df, 'n') g2 = g.settings(url_params={'play': 0}) # skip initial loadtime layout g2.plot()
Node & Edge Encodings#
You can encode your graph attributes visually using colors, sizes, icons, and more:
Direct Encoding: Set attributes like color directly on nodes or edges.
g.encode_point_color('type', categorical_mapping={'A': 'red', 'B': 'blue'}, default_mapping='gray').plot()
Example visualization:
Example visualization (static):
Categorical & Continuous Mappings: Handle both discrete and continuous data:
g.encode_point_color('score', ['blue', 'yellow', 'red'], as_continuous=True).plot()
Encodings List: Beyond colors, you can also adjust edge thickness, node icon, and add badges using the following methods:
Points:
Edges:
Collections (advanced coloring): Define subsets using GFQL AST helpers and color them consistently:
from graphistry import collection_set, n

collections = [
    collection_set(
        expr=n({"subscribed_to_newsletter": True}),
        name="Subscribers",
        node_color="#32CD32",
    )
]
g.collections(collections=collections, show_collections=True).plot()
See Layout settings and the Collections tutorial notebook. Tip: order matters (earlier collections override later ones) and intersections require set IDs.
Bind: Simpler data-driven settings are done through
graphistry.PlotterBase.PlotterBase.bind():g.bind(point_title='my_node_title_col')
Where:
bind(source=None, destination=None, node=None, edge=None,
  edge_title=None, edge_label=None, edge_color=None, edge_weight=None,
  edge_size=None, edge_opacity=None, edge_icon=None,
  edge_source_color=None, edge_destination_color=None,
  point_title=None, point_label=None, point_color=None, point_weight=None,
  point_size=None, point_opacity=None, point_icon=None, point_x=None, point_y=None
)
Global URL settings#
Graphistry visualizations are highly configurable via URL parameters. You can control the look, interaction, and data filters:
g.settings(url_params={'play': 7000, 'info': True}).plot()
For a complete list of parameters, refer to the official REST URL params page.
Plotting: Inline and URL Rendering#
Once you’re ready to visualize, use .plot() to render:
Inline Plotting: Directly embed interactive visualizations in your notebook or Python environment:
g.plot()
URL Rendering: Get a sharable and embeddable URL to view in the browser:
url = g.plot(render=False)
print(f"View your graph at: {url}")
You can further control the embeded visualization using URL parameters and JavaScript
Static Image Export#
For non-interactive outputs (documentation, reports, presentations), use plot_static():
# Quick static SVG (auto-displays in Jupyter)
g.plot_static()

# With styling
g.plot_static(
    graph_attr={'rankdir': 'LR', 'bgcolor': 'white'},
    node_attr={'style': 'filled', 'fillcolor': 'lightblue'}
)

# Save to file
g.plot_static(format='png', path='graph.png')
Works with any layout source (UMAP, ring, graphviz, or manual x/y positions).
See the static rendering tutorial for styling options, output formats, and complete examples.
Next Steps#
10 Minutes to GFQL: Use GFQL to query and manipulate your graph data before visualization.
Layout guide: Explore different layouts for your visualizations.
Plugins: Discover more ways to connect to your data and work with your favorite tools.
Layout catalog: Dive deeper into the layout options available in PyGraphistry.
External Resources#
To dive deeper into graph analytics and visualizations, check out the following resources:
Happy graphing!